For more detailed usage instructions, please refer to the FTP Data page /Manual/User_Manual_v1.1.pdf.
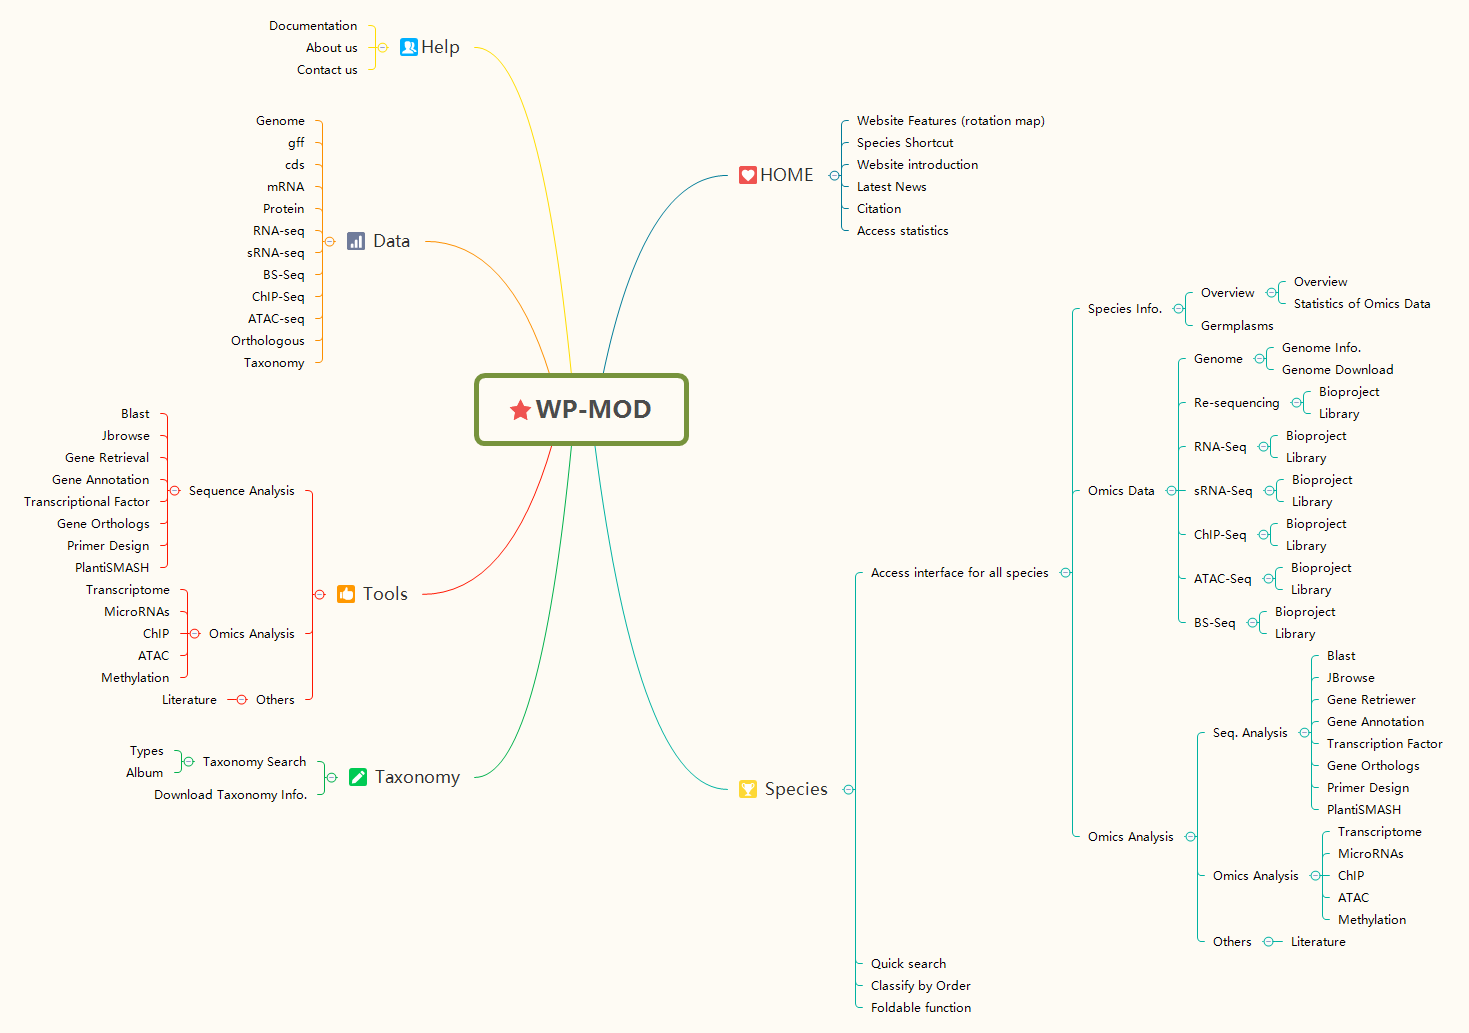
The link of Woody Plant Database home page is https://woodyplant.com/.
For access to data, users can visit the Omics, Taxonomy, Tools or Data section in the navigation bar.

1.WP-MOD Logo
Users can return to the home page from any The Woody Plant Database (WP-MOD) page by clicking the logo.
2.Navigation bar
WP-MOD provides navigation bar at the top of all of its pages to allow users to easily move between sections of the database.
3.Introduction of The Woody Plant Database
Brief summary about data in database. Goals and expectations of WP-MOD.
4.Species Shortcut
By clicking on the image for the species of interest, go to the Omics page where you can access all the data and tools available of this species.
5.Latest News
Updated data and new versions from WP-MOD.
If you have any questions or comments about the website overview, please let us know via contact@woodyplant.com.
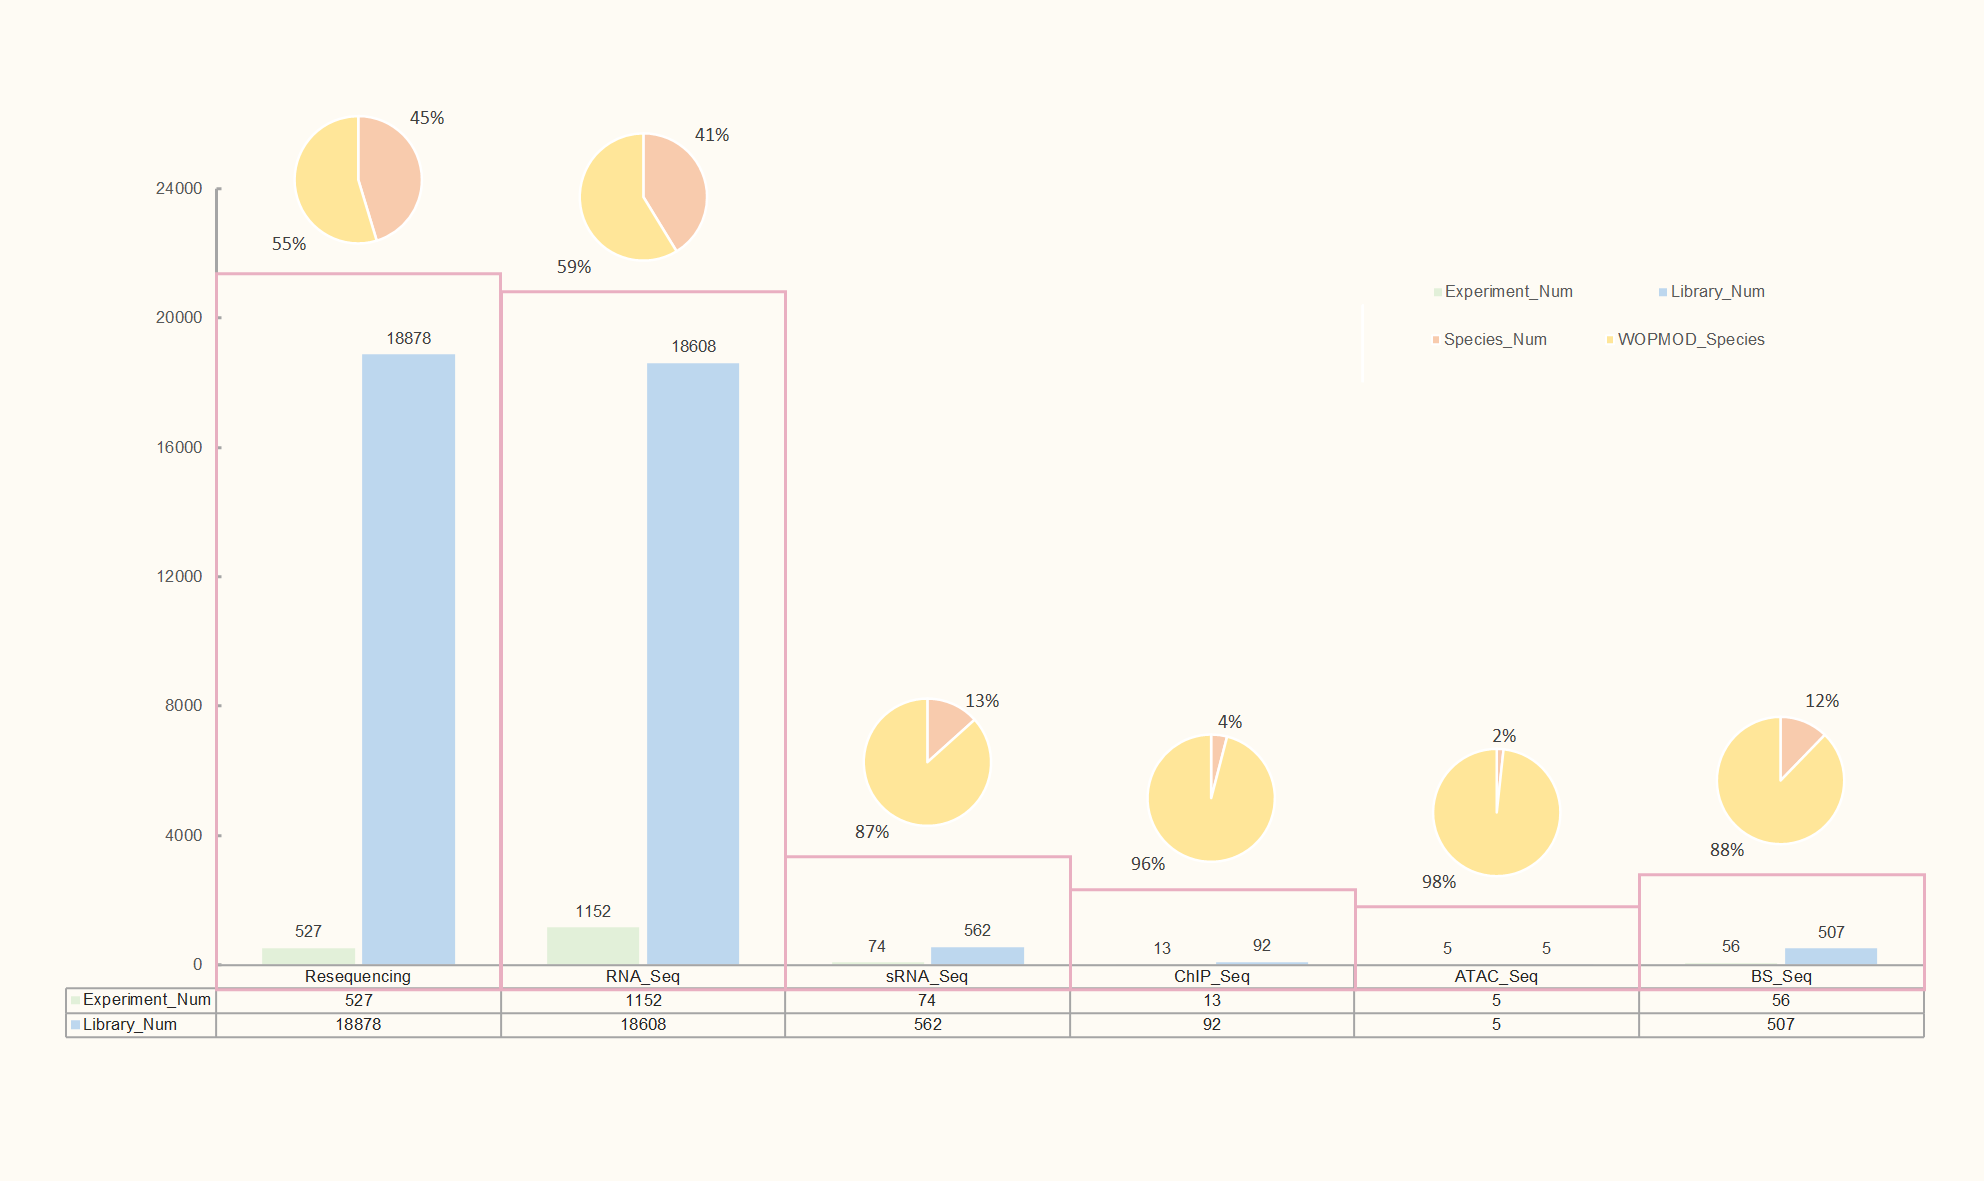
The Species section includes 373 subpages named after species scientific names. Users can directly search for species using their Latin names or browse species by order. This allows convenient and direct access to data and tools relevant to the species of interest.
The Species pages have Basic Info. bar and Tools bar on the left panel so that users can quickly access data and tools for the species. Depending on the species, more or less items will be displayed on the resource bar. Below are some items in the resource bars.
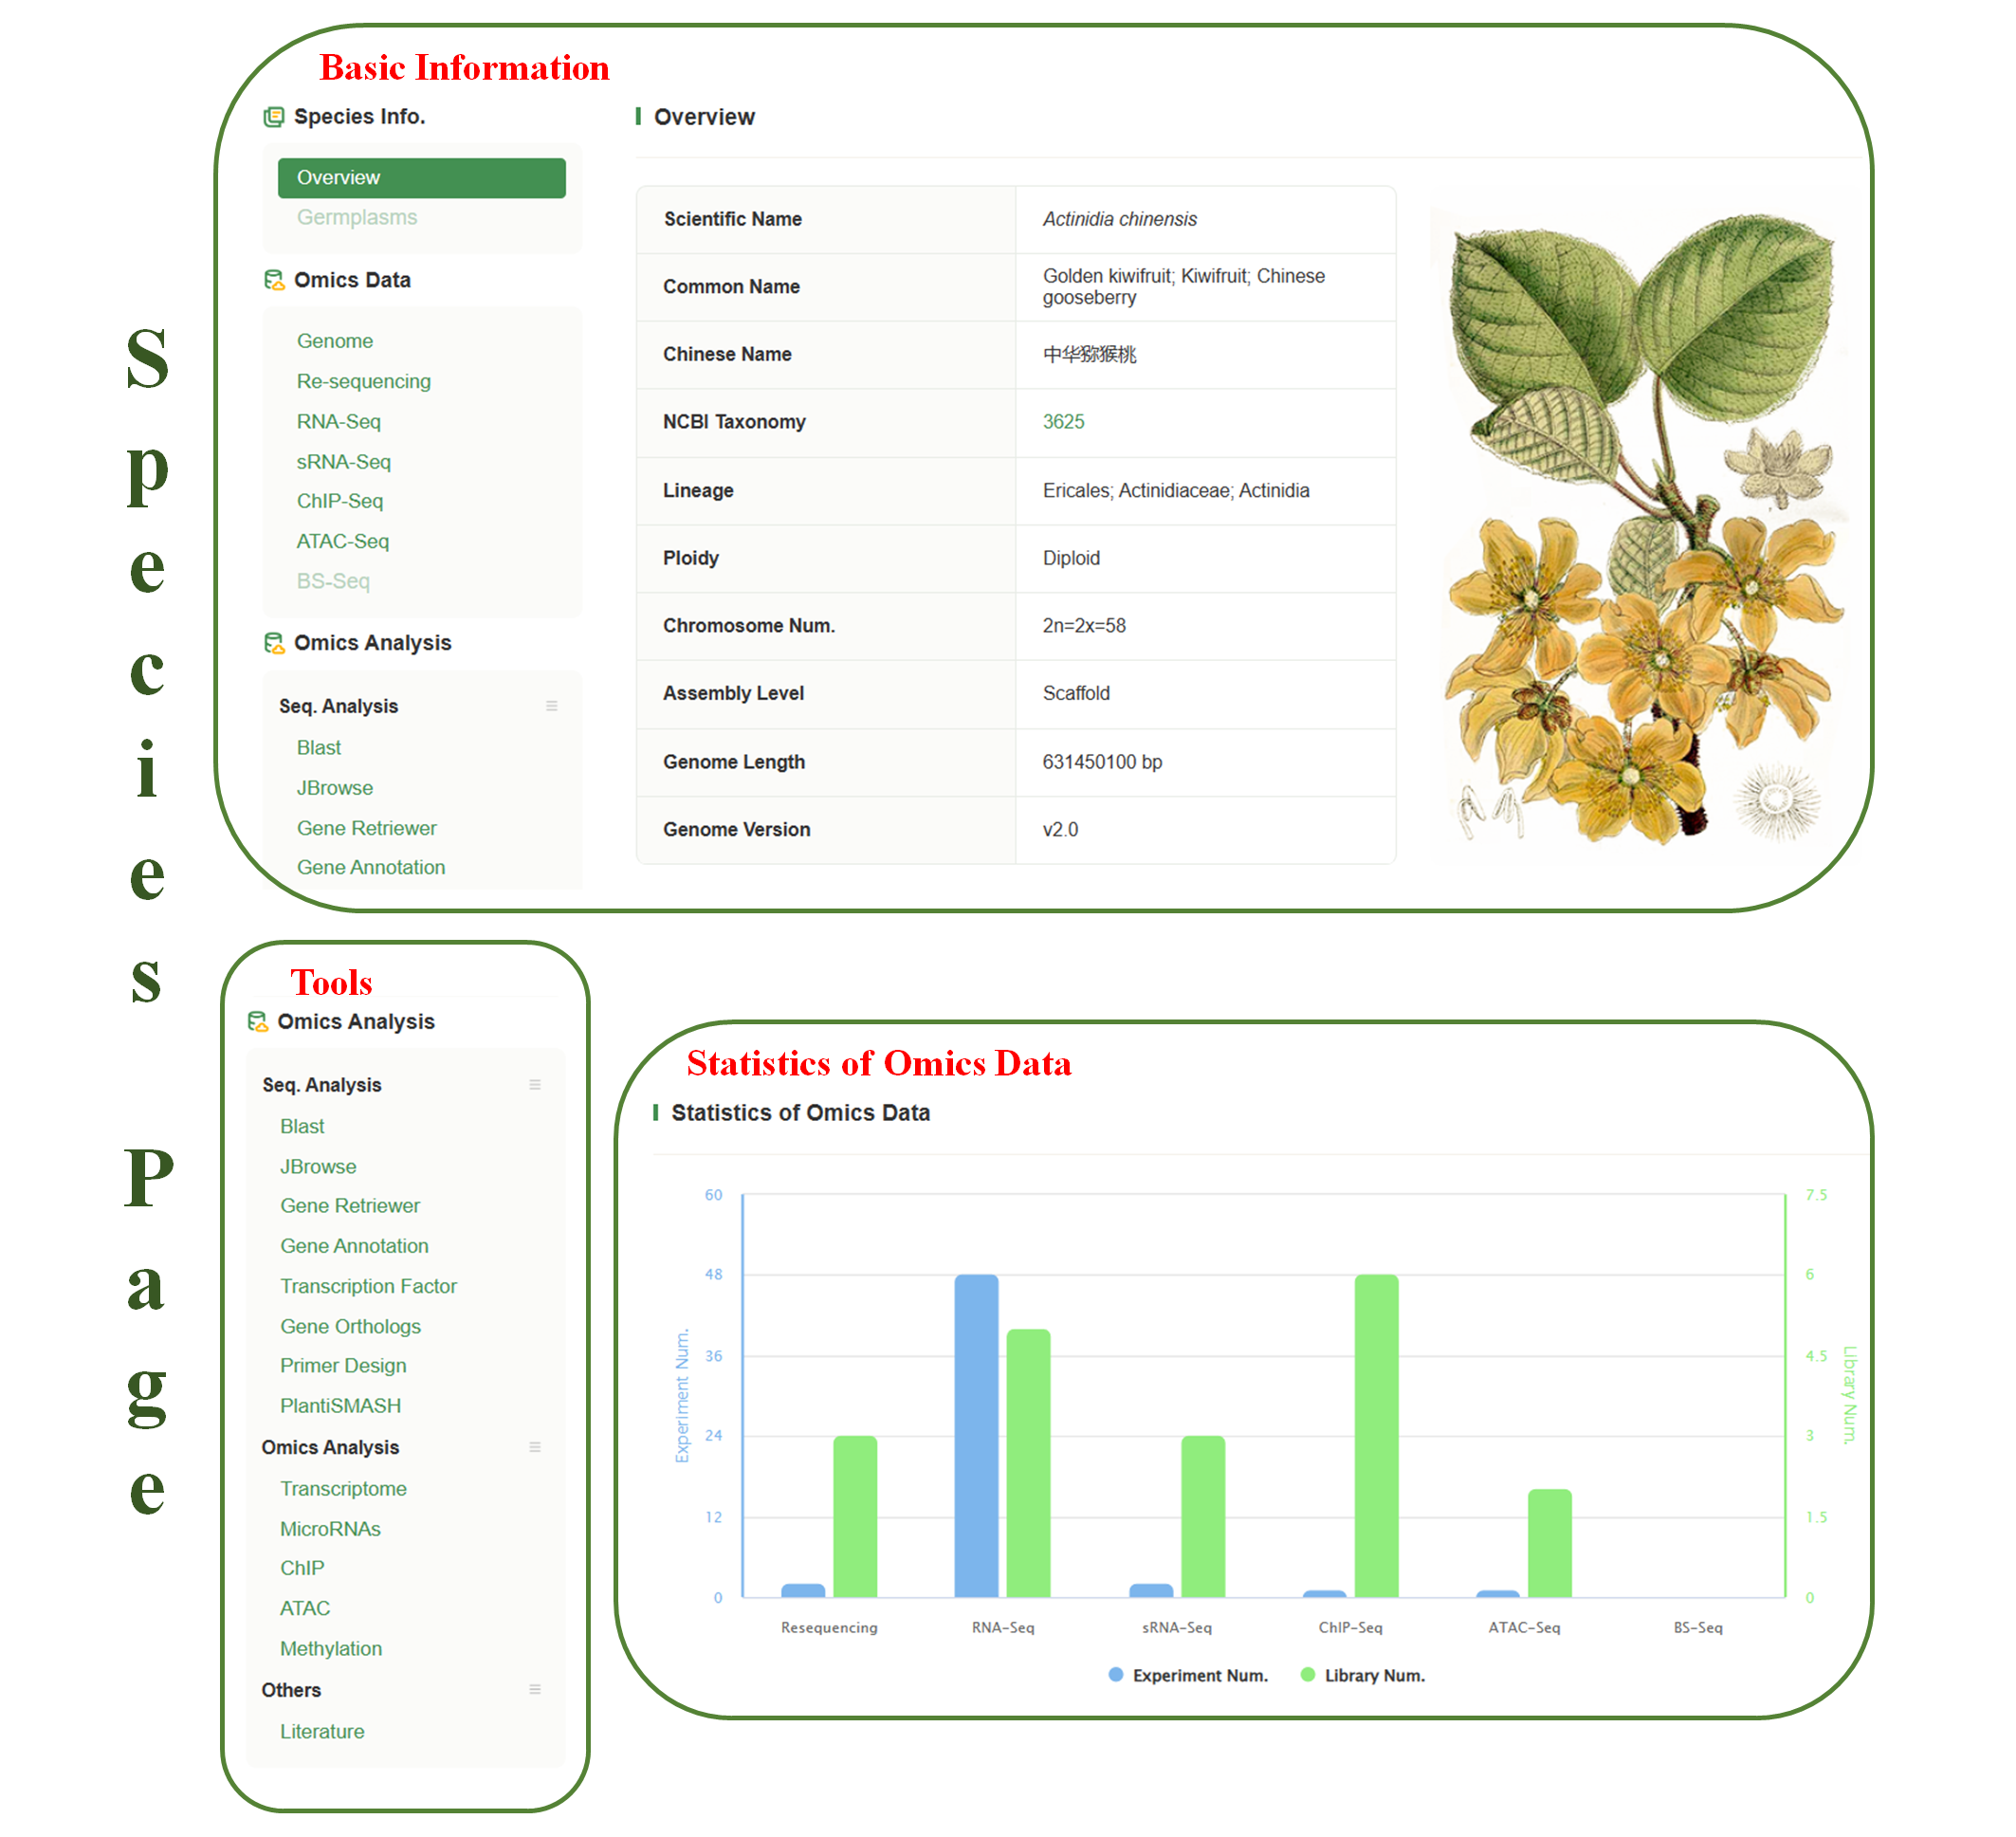
★Basic Info.
1.Germplasms & Germplasm detailed page
The germplasms page provides a list of germplasm that are stored in Woody Plant Database. An interactive map shows the distribution of collected germplasms around the world. The detailed information for each germplasm is shown by clicking on the ‘Name’ or ‘ID’. Images and recorded phenotypes are also store in detailed pages.
2.Genomes
Where whole genome sequences are available, hyperlinks to each genome assembly page are shown on the Basic Info bar.
3.Downloads
FTP links to assemble and annotation files of the species.
4.Annotation
Where mRNA, cDNA, protein sequences are available, hyperlinks to each genome annotation page are shown on the Basic Info bar.
5.Literature
Continue to update the latest research publications. User can search latest literature of the species, and filter by key words.
WP-MOD provides classification information for 373 woody plants, including their scientific names and publishing institutions (individuals). Users can search for specific species by entering scientific names or other keywords and clicking the 'Search' button. Additionally, by clicking the 'Download Taxonomy Info' button, users can download the classification information.
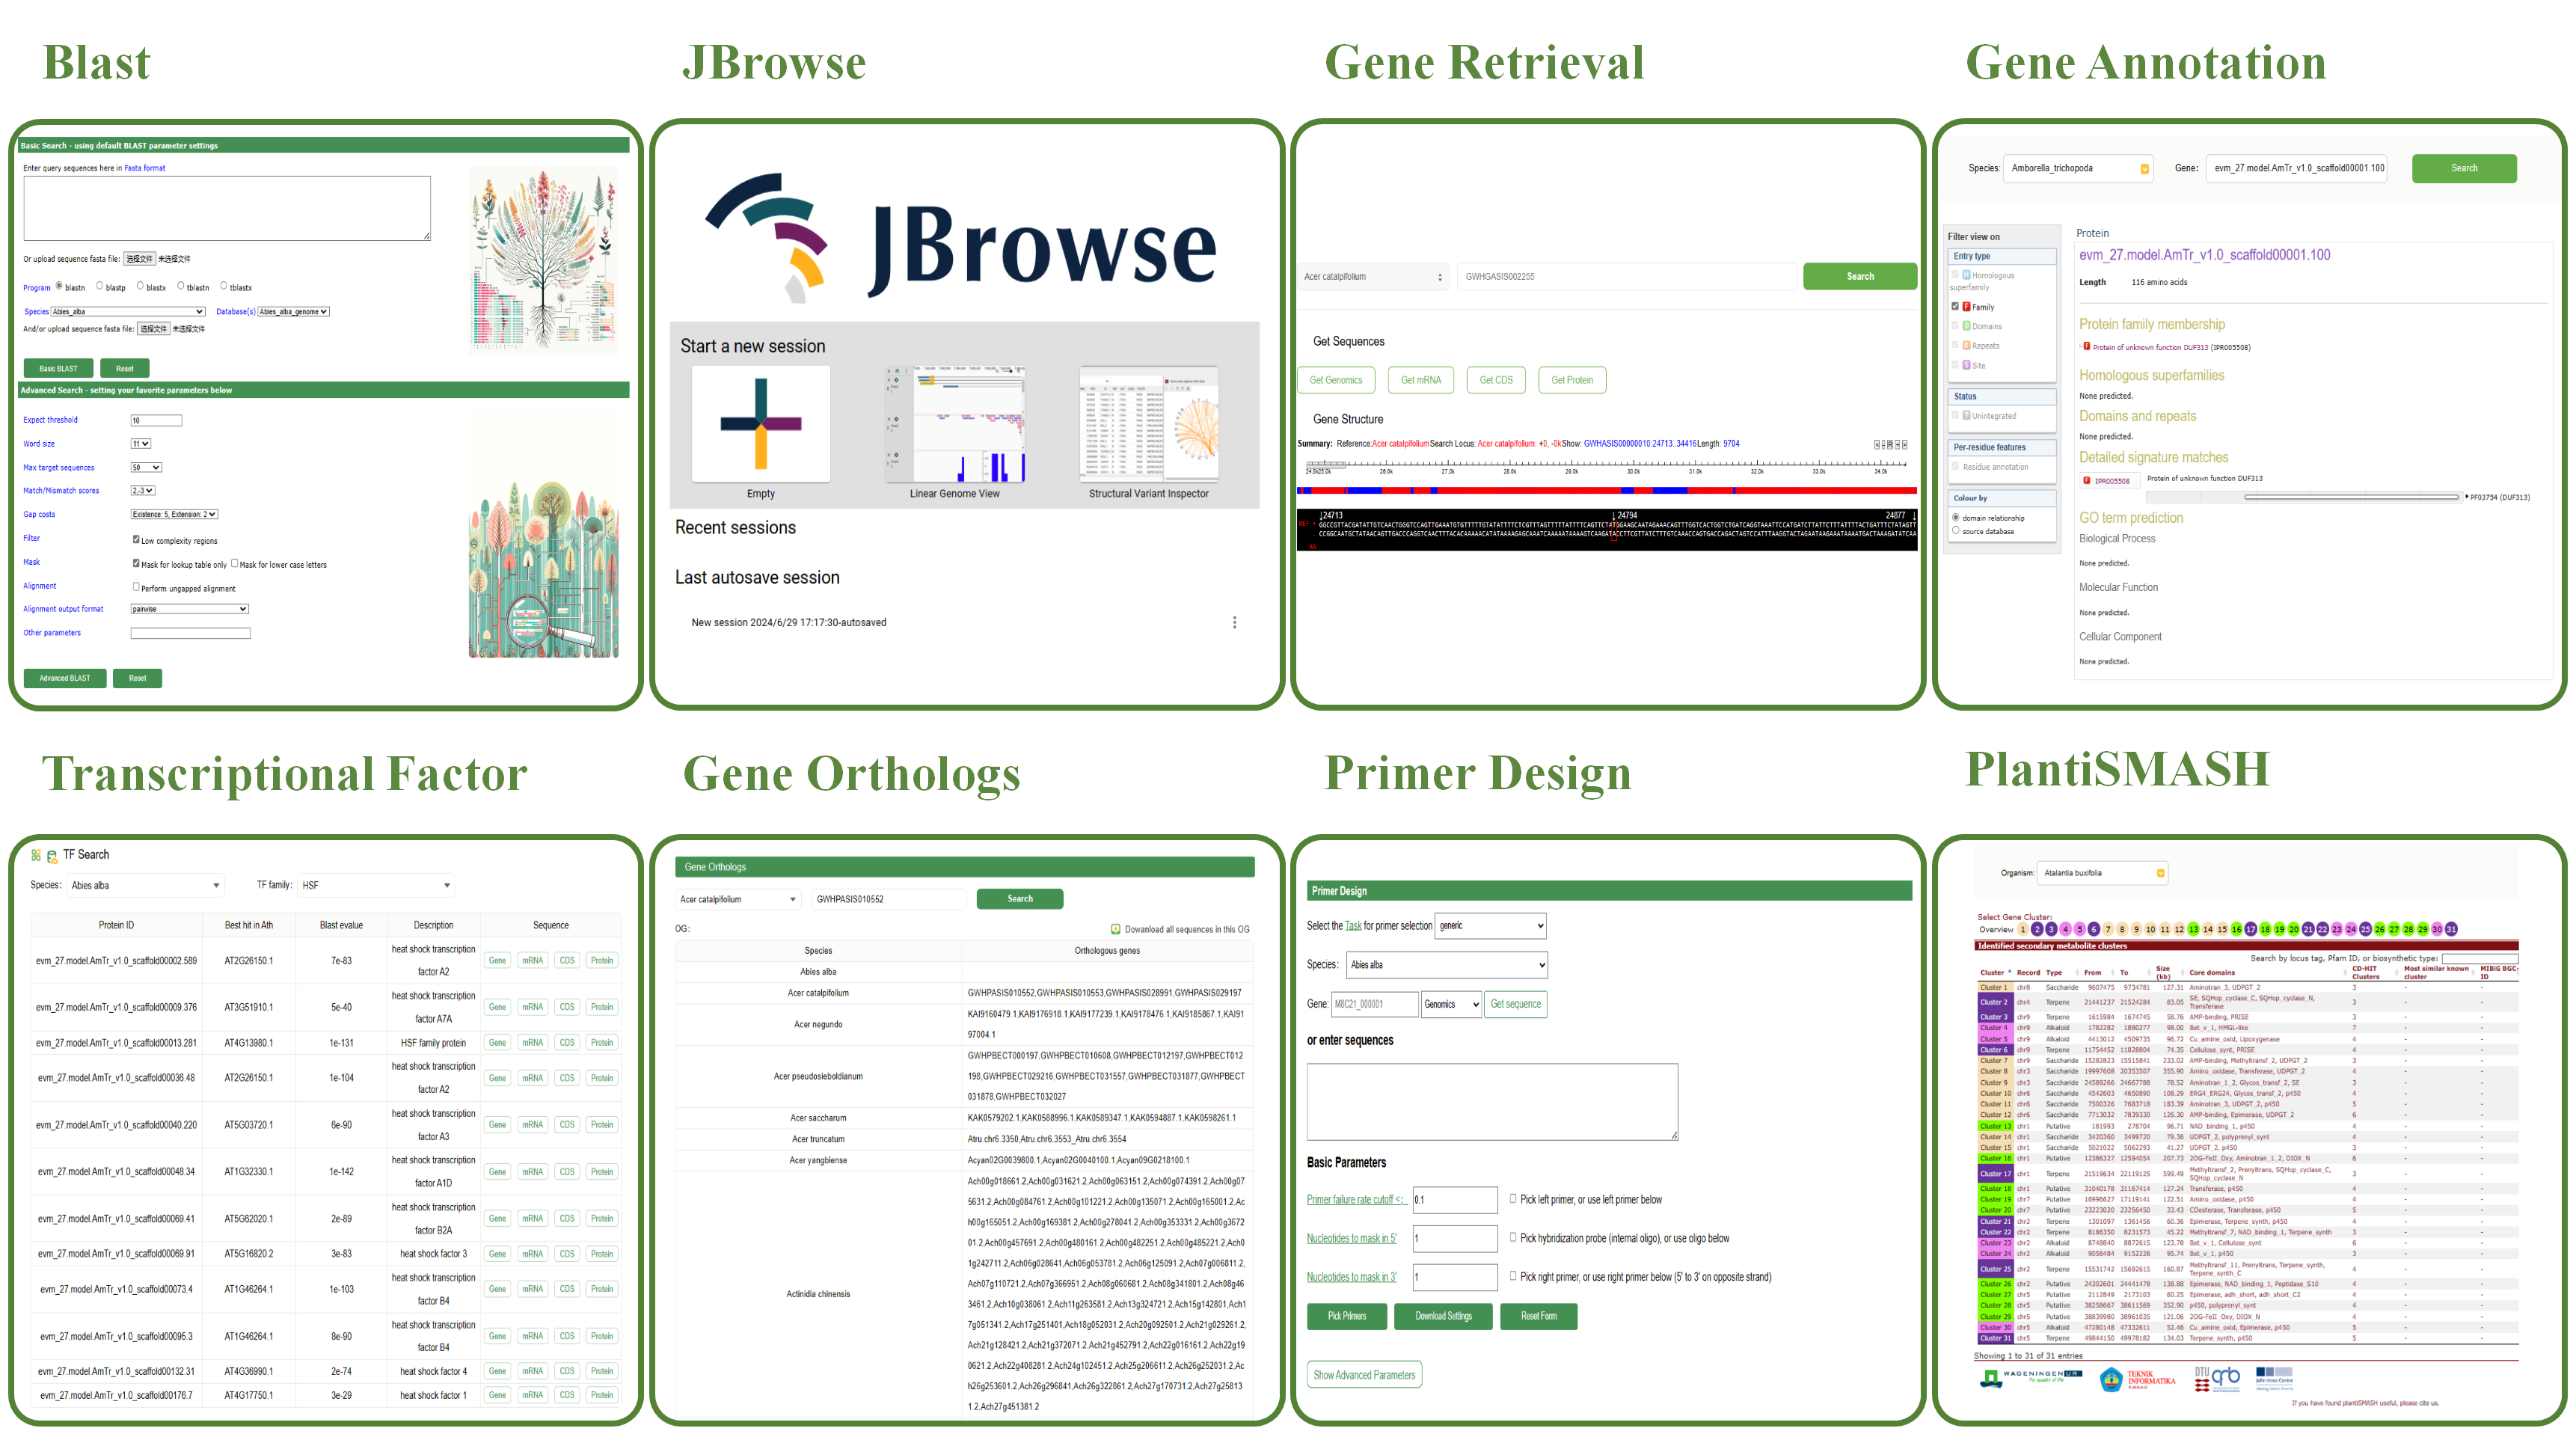
The BLAST tool in the Woody Plant Database enables users to perform sequence alignment searches efficiently. It automatically selects the analysis method based on the input sequence and selected database.
1. Basic Search
♦ Input Sequence: Paste a query sequence (DNA or protein) into the input box or upload a FASTA file.
♦ Automatic Program Selection: The system determines the appropriate BLAST program:
blastn: For nucleotide vs nucleotide searches.
blastp: For protein vs protein searches.
blastx: Translates nucleotide to protein for alignment against proteins.
tblastn: Protein query against translated nucleotide sequences.
tblastx: Translates nucleotide sequences for comparison.
♦ Database Selection: Users can select nucleotide or protein databases by checking the respective boxes.
2. Results
The BLAST results include visual outputs, alignment scores, and E-values.
♦ Options include: Download results in FASTA, XML, or TSV format. Graphical overviews and alignments.
JBrowse is an open-source genome browser widely used for visualizing and sharing genomic data. Below are the three session modes offered by JBrowse:
1.Empty Session
Start a new session with a blank slate, without loading any preset data. Users have full flexibility to customize the session content and add the desired genomic data.
2.Linear Genome View
Selecting this option initiates a session with a linear genome view. Genomic data will be displayed in a one-dimensional linear format, making it easier for users to browse and analyze genome sequences and their annotations.
3.Structural Variant Inspector
This option is specifically designed to start a session focused on inspecting and analyzing structural variants in the genome. This feature allows users to efficiently identify and study structural variations within the genome.

WP-MOD provides a dedicated tool for gene search with two main functionalities:
1.Get Sequences
♦ Get Genomics Button: Retrieve the genomic sequence of the selected gene. ♦ Get mRNA Button: Retrieve the mRNA sequence of the selected gene. ♦ Get CDS Button: Retrieve the coding DNA sequence (CDS) of the selected gene. ♦ Get Protein Button: Retrieve the protein sequence encoded by the selected gene.
2.Gene Structure
♦ Summary: Offers a brief description of the selected gene, including the reference genome, gene location, and the length of displayed sequence fragments. ♦ Gene Structure Diagram: Illustrates the structure of the gene, with blue boxes representing exons and black lines representing introns. ♦ Sequence and Position: Displays the precise DNA sequence of the selected segment and its location within the genome. ♦ REF Marker: Indicates the reference sequence.
Gene functions were annotated using InterProScan27 (v5.24) by searching against publicly available databases, including ProDom, PRINTS, Pfam, SMRT, PANTHER and PROSITE. The Gene Ontology (GO) and KEGG IDs for each gene were assigned according to the corresponding InterPro entry. In this module, you can select an organism through the Organism dropdown menu and enter the gene ID you wish to query in the Gene field. This will provide you with annotation results obtained through InterProScan.
The Transcription Factor (TF) module in WP-MOD allows users to search and analyze transcription factors within various species. The key features of this module include:
1.Species Selection
Users can select the desired species from a dropdown menu. This enables targeted searches within the chosen organism.
2.TF Family Selection
Users can choose a specific TF family to narrow down their search, making it easier to find relevant transcription factors.
3.Search Results
The search results are displayed in a table format, including the following columns:
♦ Protein ID: The unique identifier for each protein. ♦ Best Hit in Ath: The best BLAST hit in Arabidopsis thaliana, providing a reference point for comparison. ♦ Blast E-value: The E-value from the BLAST search, indicating the significance of the match. ♦ Description: A brief description of the transcription factor, including its function and characteristics. ♦ Sequence: Links to retrieve various sequences related to the transcription factor, including genomic sequence (Gene), mRNA sequence (mRNA), coding DNA sequence (CDS), and protein sequence (Protein).
The Gene Orthologs tool in WP-MOD allows users to search and analyze orthologous genes across different species. The key features of this tool include:
1.Species Selection
Users can select the desired species from a dropdown menu. This enables targeted searches within the chosen organism.
2.Gene ID Input
Users can enter the gene ID they wish to query in the provided input field. This allows for precise searches for orthologous genes related to the specified gene ID.
3.Search Results
The search results are displayed in a table format, including the following columns:
♦ Species: The name of the species in which the orthologous genes are found. ♦ Gene IDs: A list of gene IDs that are orthologous to the queried gene in the selected species.
4.Download Option
Users can download all sequences in the orthologous group (OG) by clicking the download button. This feature facilitates easy access to the data for further analysis.
The Search by GO tool in WP-MOD allows users to search and analyze Gene Ontology (GO) annotations for specific species and genes. The key features of this tool include:
1. Species Selection
Users can select the desired species from a dropdown menu. This enables targeted searches for GO annotations specific to the selected organism.
2. GO ID Input
Users can enter a specific GO ID in the input field to search for related genes and their GO term predictions.
3. Search Results
The search results are displayed in a tabular format, containing the following columns:
♦ Serial Number: Each row in the table has a checkbox next to its Serial Number. Users can check these boxes to select specific rows of data and download them. ♦ Species: The name of the species to which the gene belongs. ♦ Gene ID: A unique identifier for the specific gene being analyzed. ♦ GO Term Prediction: A list of predicted GO terms associated with the gene, including the GO ID and its description.
4. Download Option
Users can download the results in two ways:
♦ Download Selected: Allows downloading only the selected results. ♦ Download All: Facilitates downloading all search results for further analysis.
This tool helps researchers easily identify and extract functional GO annotations related to genes within the selected species, providing a streamlined interface for data retrieval and analysis.
The PlantSMASH tool in WP-MOD is designed for the identification and analysis of secondary metabolite biosynthetic gene clusters in plant genomes. The key features of this tool include:
1.Organism Selection
Users can select the desired organism from a dropdown menu to focus their analysis on a specific plant species.
2.Gene Cluster Selection
Users can select specific gene clusters by clicking on the numbered buttons. Each button corresponds to a different gene cluster identified within the selected organism.
3.Cluster Overview
The overview section displays identified secondary metabolite clusters. This section includes the following columns:
♦ Cluster: The cluster number for easy reference. ♦ Record: The identifier for the cluster record. ♦ Type: The type of secondary metabolite (e.g., Terpene, Saccharide, Polyketide, Alkaloid). ♦ From - To: The genomic coordinates where the cluster is located. ♦ Size (kb): The size of the cluster in kilobases. ♦ Core Domains: The core domains present within the cluster, which are crucial for the biosynthesis of the metabolite. ♦ CD-HIT Clusters: The number of CD-HIT clusters, indicating sequence similarity groups.Most Similar Known Cluster: The most similar known cluster for comparative purposes. ♦ MIBiG BGC-ID: The identifier from the Minimum Information about a Biosynthetic Gene cluster database (MIBiG) if available.
4.Search Functionality
Users can search for clusters by locus tag, Pfam ID, or biosynthetic type to narrow down their results based on specific criteria.
5.Color Coding
The table is color-coded to indicate different types of secondary metabolites, making it easier to differentiate between them at a glance.
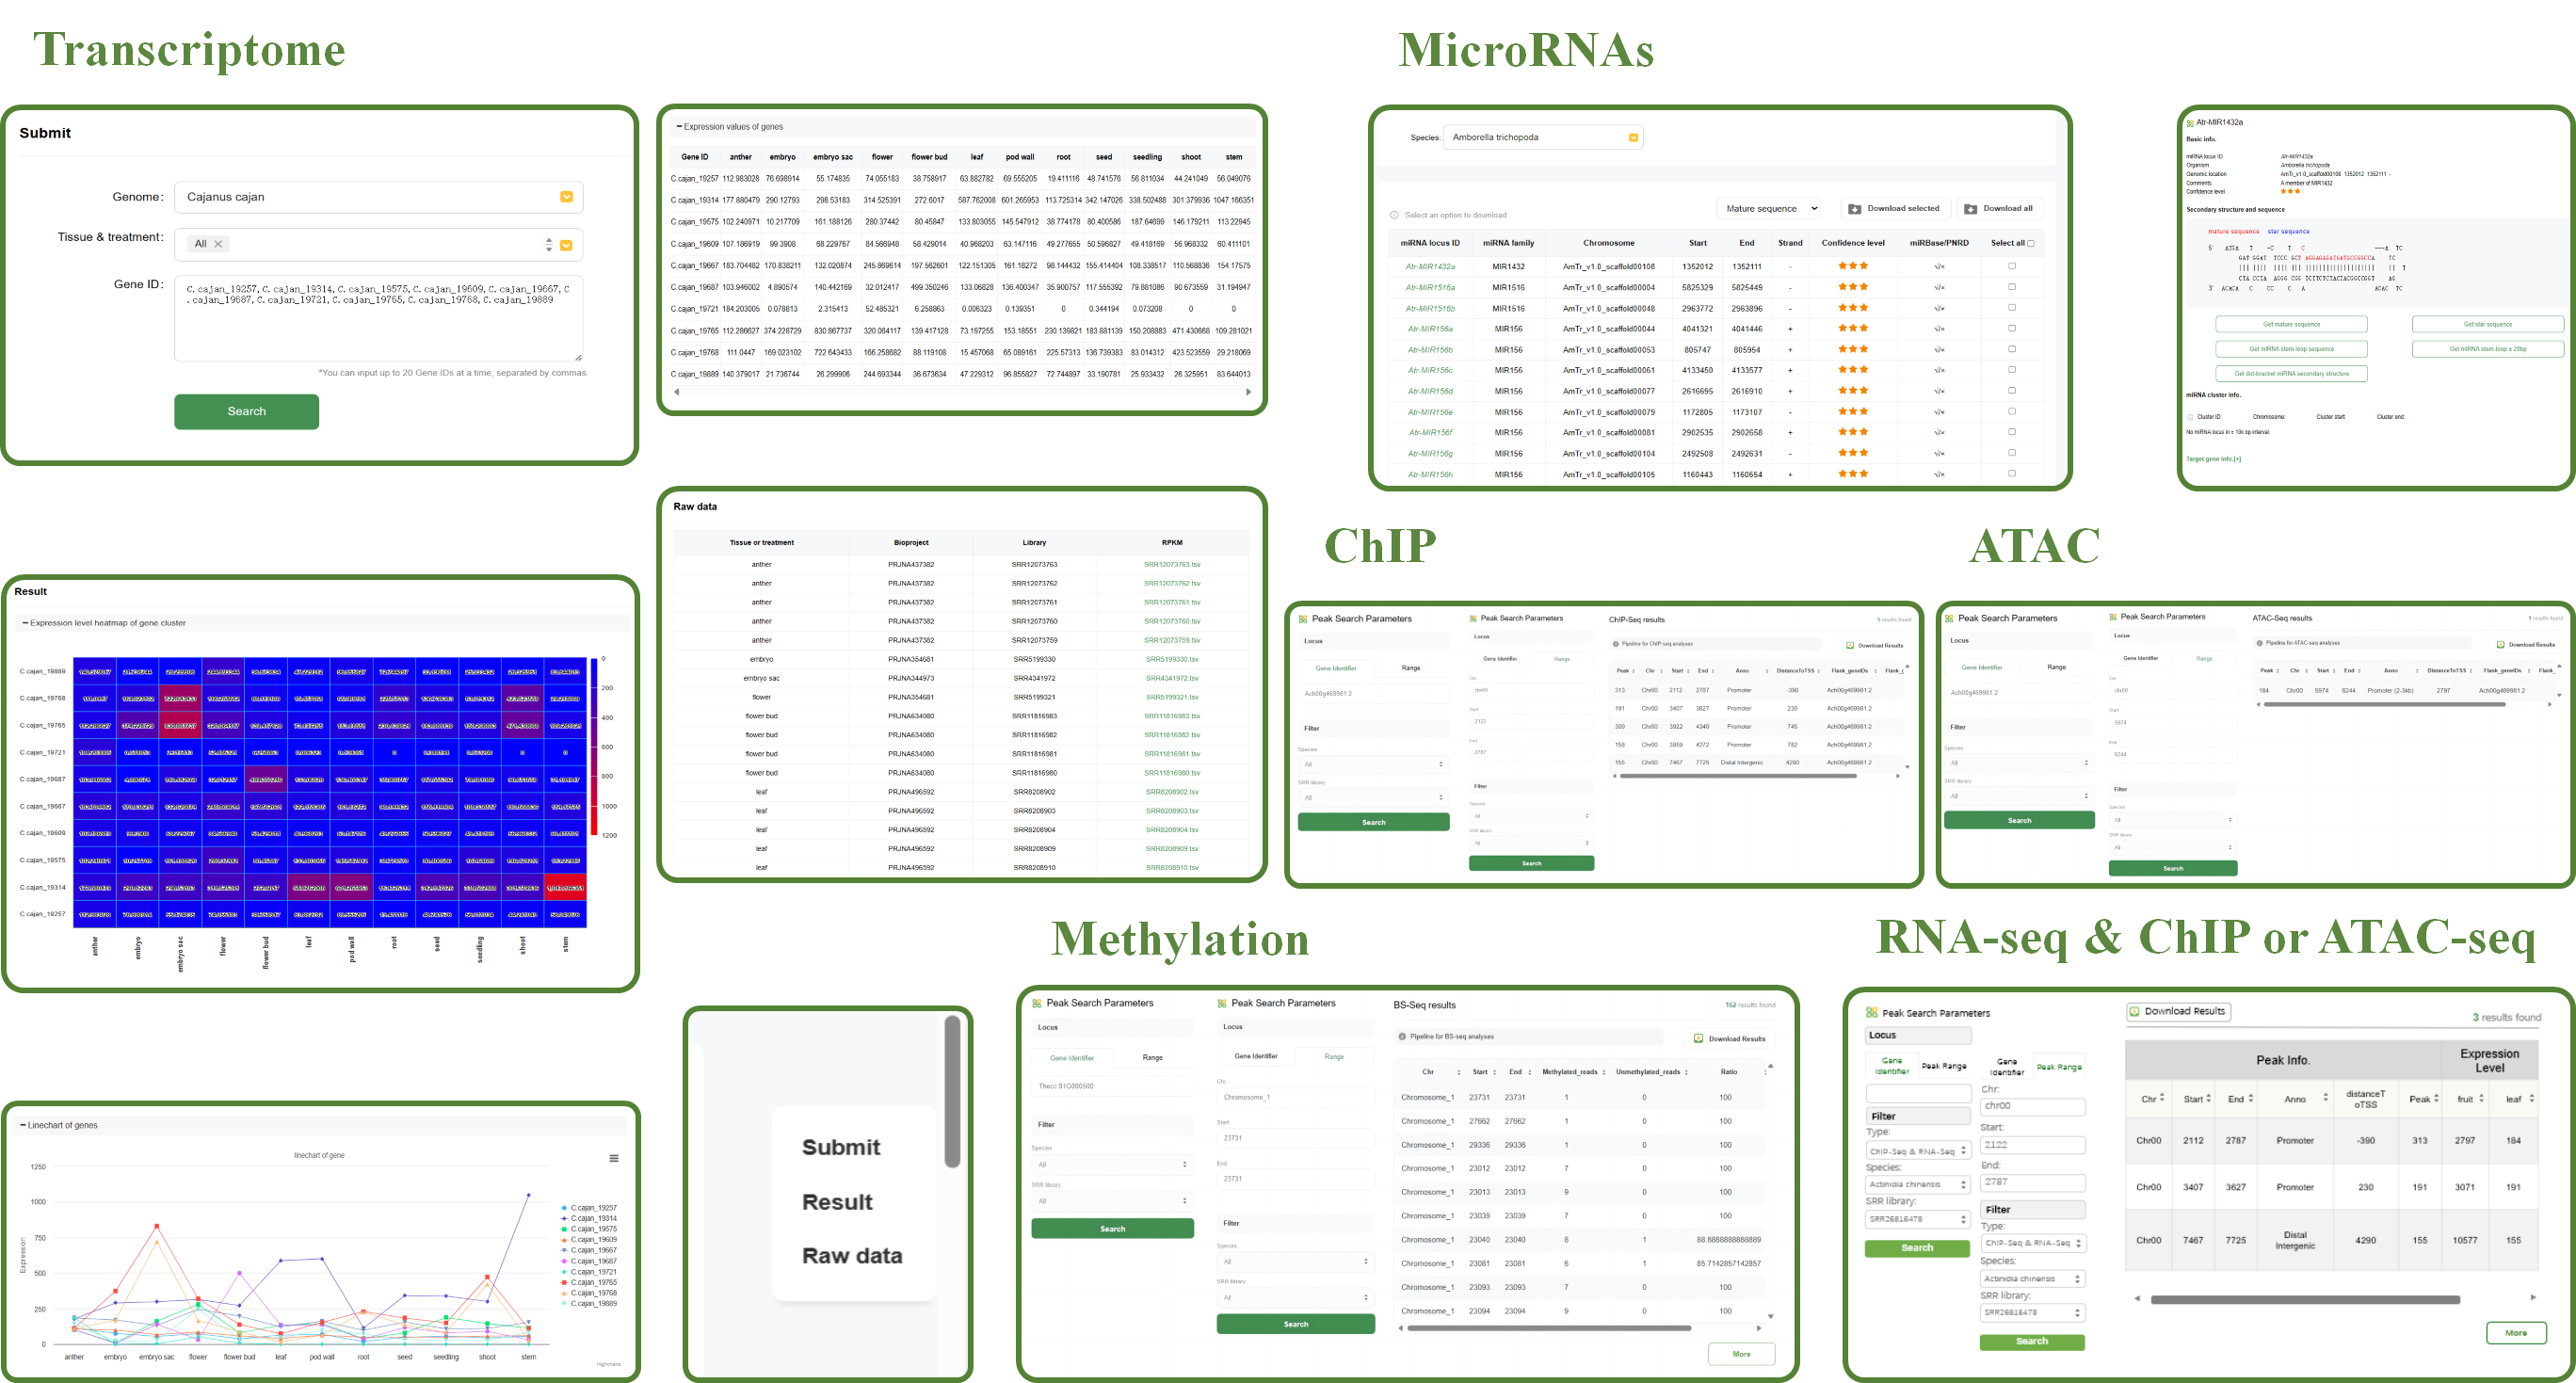
The Transcriptome tool in WP-MOD is designed to help users analyze gene expression across various tissues and treatments. The key features of this tool include:
1.Genome Selection
Users can select the desired genome from a dropdown menu, allowing for targeted analysis within a specific species.
2.Tissue & Treatment Selection
Users can specify the tissue type and treatment condition to refine their search for gene expression data.
3.Gene ID Input
Users can input up to 20 gene IDs at a time, separated by commas. This allows for focused analysis of multiple genes simultaneously.
4.Search Results
After submitting the search, the results are displayed in several formats to provide comprehensive insights into gene expression:
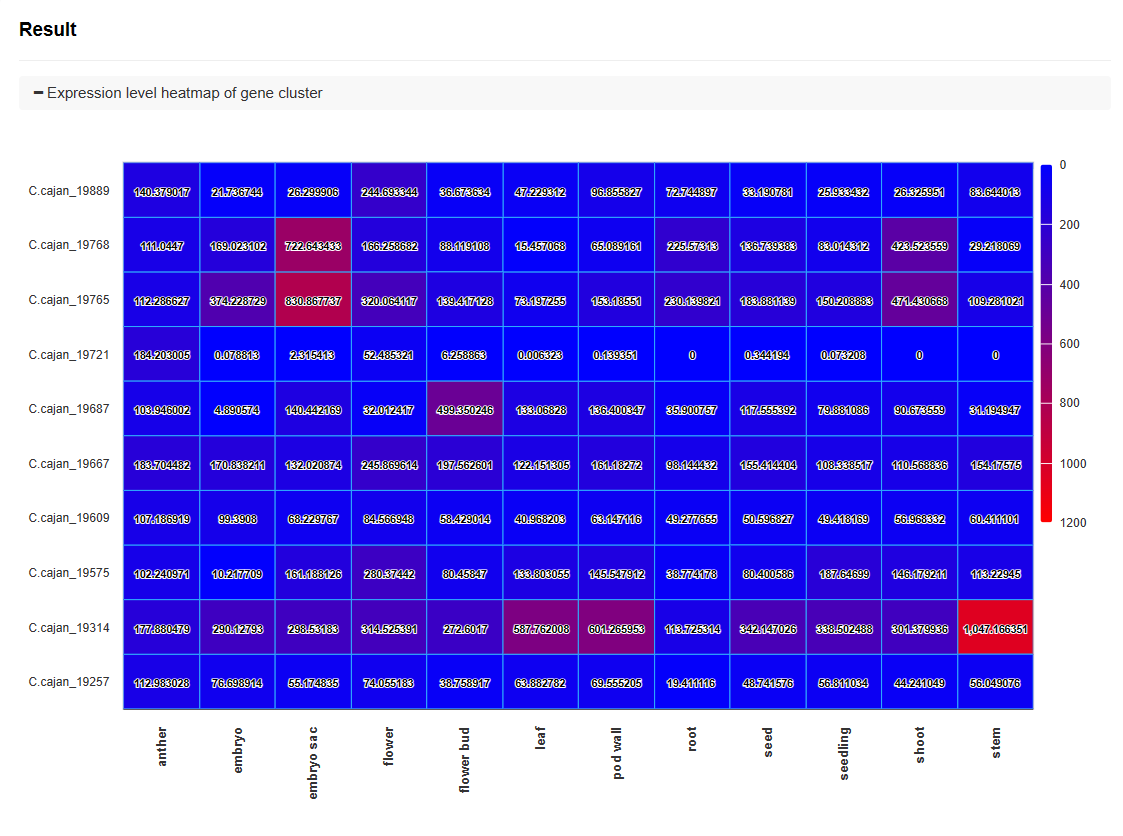
♦ Heatmap of Gene Cluster Expression Levels
A heatmap visualizes the expression levels of the gene cluster across different tissues and treatments. The color gradient indicates the level of expression, with red representing higher expression and blue representing lower expression.
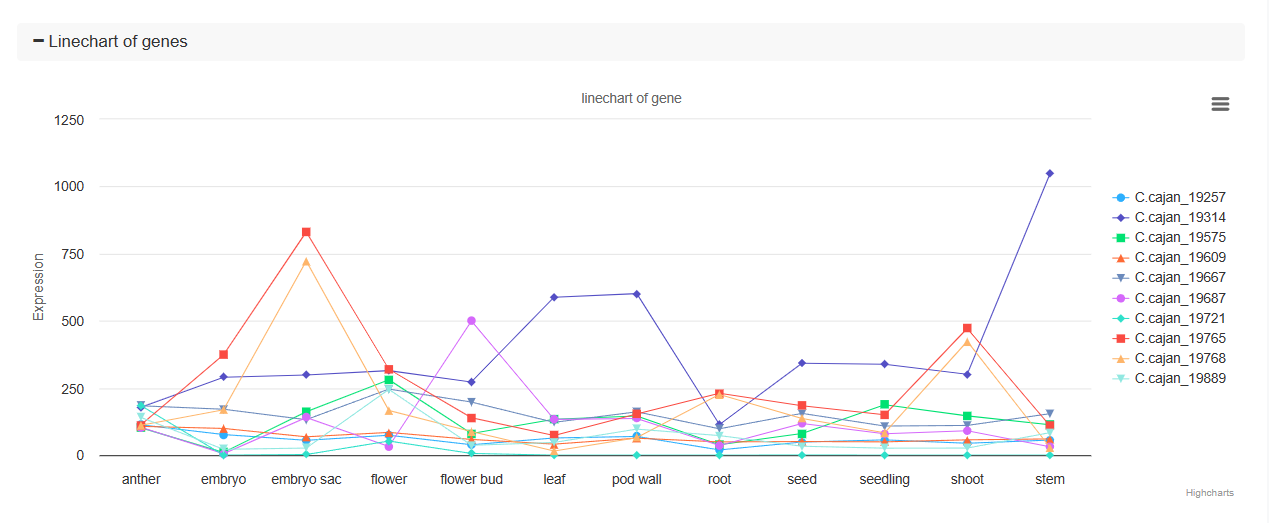
♦ Line Chart of Gene Expression
A line chart displays the expression levels of each gene across different tissues and treatments. This visualization helps in identifying trends and patterns in gene expression.
<
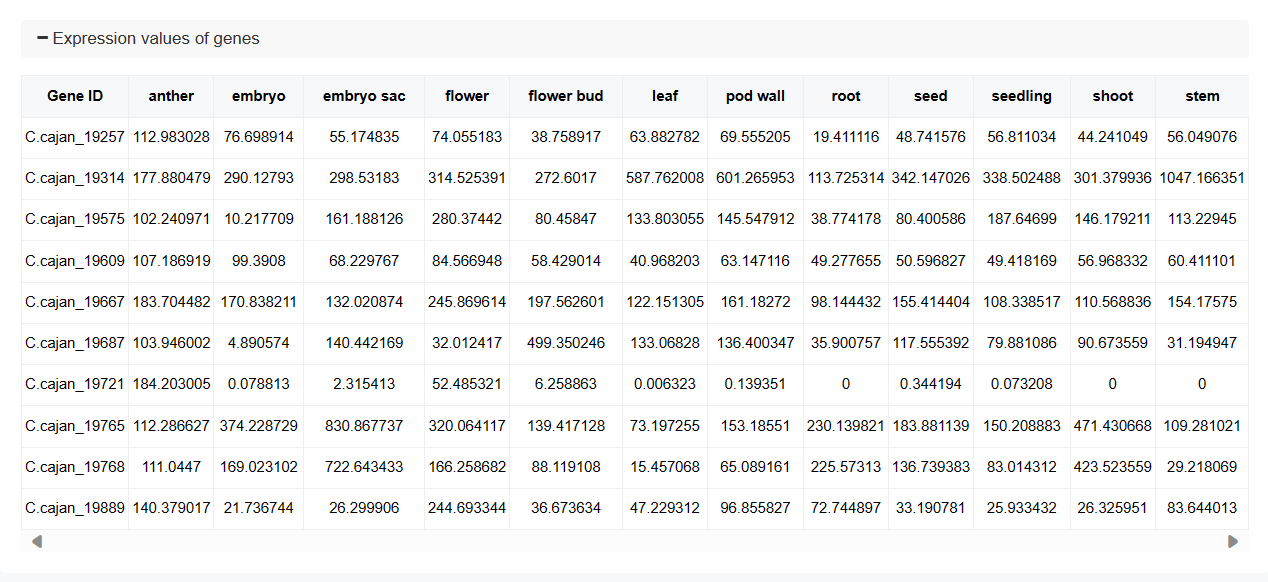
♦ Expression Values Table
A detailed table lists the expression values for each gene in various tissues and treatments, providing precise numerical data for further analysis.
♦ Raw Data
The raw data section includes detailed information about the datasets used, such as tissue or treatment, biosample, library, and SRA (Sequence Read Archive) IDs. This information is crucial for verifying and reproducing the analysis.

5. Software and Parameters
♦ Trim Galore (Adapter Trimming):
Software: Trim Galore
Parameters: '-q 20 --stringency 3 --length 20 --gzip'
Purpose: Removes sequencing adapters and low-quality bases from raw RNA-seq reads.
♦ HISAT2 (Read Mapping):
Software: HISAT2
Parameters: '-p 10 -x genome_index -1 Purpose: Maps cleaned RNA-seq reads to the reference genome.
♦ StringTie (Transcript Assembly and Quantification):
Software: StringTie
Parameters: '-p 10 -G genome.gtf -e'
Purpose: Assembles transcripts and estimates expression levels (FPKM, TPM) from mapped reads. Additionally, the prepDE.py script is used with StringTie outputs to extract count matrices for downstream differential expression analysis (e.g., DESeq2).
This pipeline ensures accurate RNA-seq data processing, including adapter trimming, read alignment, transcript assembly, and expression quantification, while facilitating downstream analysis with extracted count matrices.
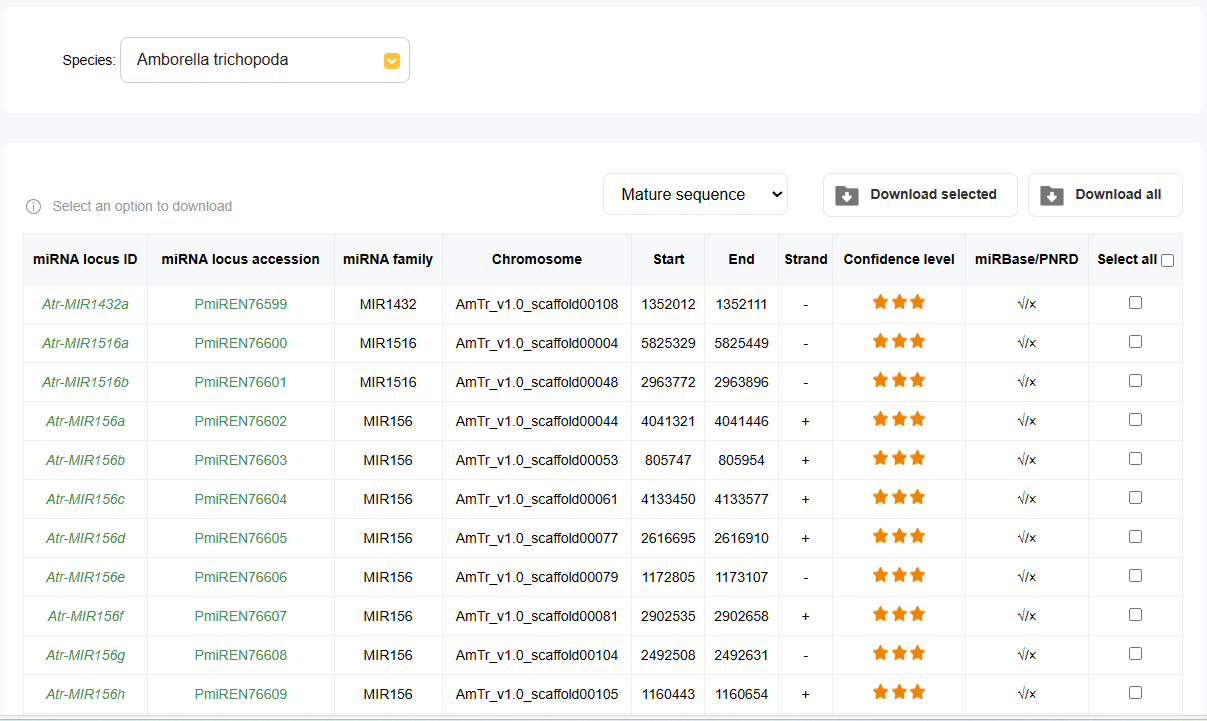
The miRNA tool in WP-MOD is designed for the comprehensive analysis and retrieval of microRNA (miRNA) data across various species.
The key features of this tool include:
1.Species Selection
Users can select the desired species from a dropdown menu, allowing for targeted analysis within a specific organism.
2.miRNA Categories
The tool provides access to various miRNA categories such as:
♦ MIR families:
The different miRNA families identified within the species.
♦ MIR loci:
The specific genomic locations of the miRNA genes.
♦ Clusters:
Groups of miRNA genes that are co-located on the genome.
♦ sRNA-Seq data:
Small RNA sequencing data.
3.miRNA Locus Information
The table displays detailed information about each miRNA locus, including:
♦ miRNA Locus ID:
The unique identifier for the miRNA locus.
♦ miRNA Family:
The family to which the miRNA belongs.
♦ Chromosome:
The chromosome on which the miRNA locus is located.
♦ Start and End:
The genomic coordinates defining the miRNA locus.
♦ Strand:
The DNA strand (+ or -) on which the miRNA is encoded.
♦ Confidence Level:
The confidence level of the miRNA annotation, often indicated by a star rating.
♦ miRBase/PNRD:
Links to corresponding entries in miRBase and PNRD databases, if available.
4.Sequence Selection and Download
Users can select the desired miRNA sequences from a dropdown menu, with options including:
♦ Mature sequence
♦ Star sequence
♦ miRNA stem-loop sequence
♦ miRNA stem-loop +/- 20 bp
Options to download selected miRNA sequences or all available sequences in the chosen category are provided, facilitating easy access to the data for further analysis.
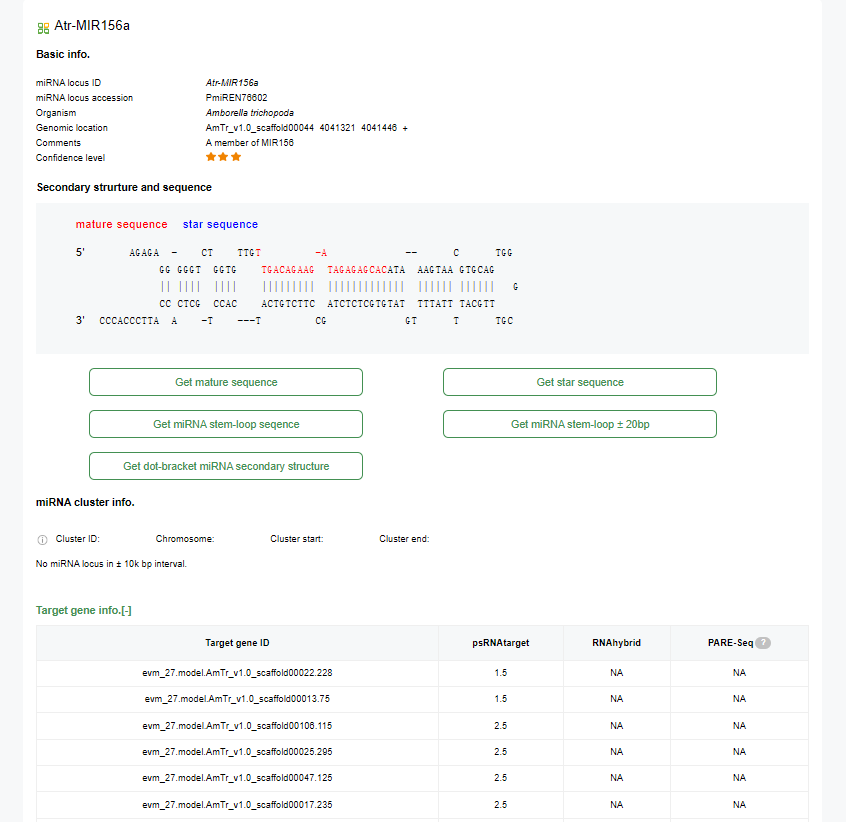
5.miRNA Locus Detail Page
♦ Basic info:
miRNA locus ID, Organism, Genomic location, Comments, and Confidence level.
♦ Secondary structure and sequence:
Shows the mature sequence and star sequence of the miRNA with base pairing and mismatches indicated.
♦ Options to download sequences:
Buttons to get mature sequence, star sequence, miRNA stem-loop sequence, and miRNA secondary structure in dot-bracket notation.
♦ miRNA cluster info:
Cluster ID, Chromosome, Cluster start, Cluster end, or indicates that there is no miRNA locus within a 10k bp interval.
♦ Target gene info:
Indicates that no target gene is identified.
6. Software and Parameters
♦ Trim Galore (Adapter Trimming):
Software: Trim Galore
Parameters: '--small_rna --length 18 --max_length 26 --dont_gzip --suppress_warn'
Purpose: Removes adapters and filters raw reads to retain only sRNAs with a length between 18 and 26 nucleotides.
♦ miRDeep-P2 (miRNA Identification):
Software: miRDeep-P2
Parameters: '-g genome.fa -x bowtie_index -L 15 -R 5 -p 1 -q'
Purpose: Identifies novel and known miRNAs by aligning small RNA reads to the reference genome using Bowtie and predicting miRNA precursors with RNAfold.
♦ miRAnno (miRNA Annotation):
Software: miRAnno
Parameters: '-s Purpose: Annotates miRNAs based on the PmiREN database, linking predicted miRNAs to their known functions and species-specific roles.
This pipeline ensures high-quality miRNA discovery and annotation by integrating adapter trimming, miRNA identification, and functional annotation into a streamlined workflow.
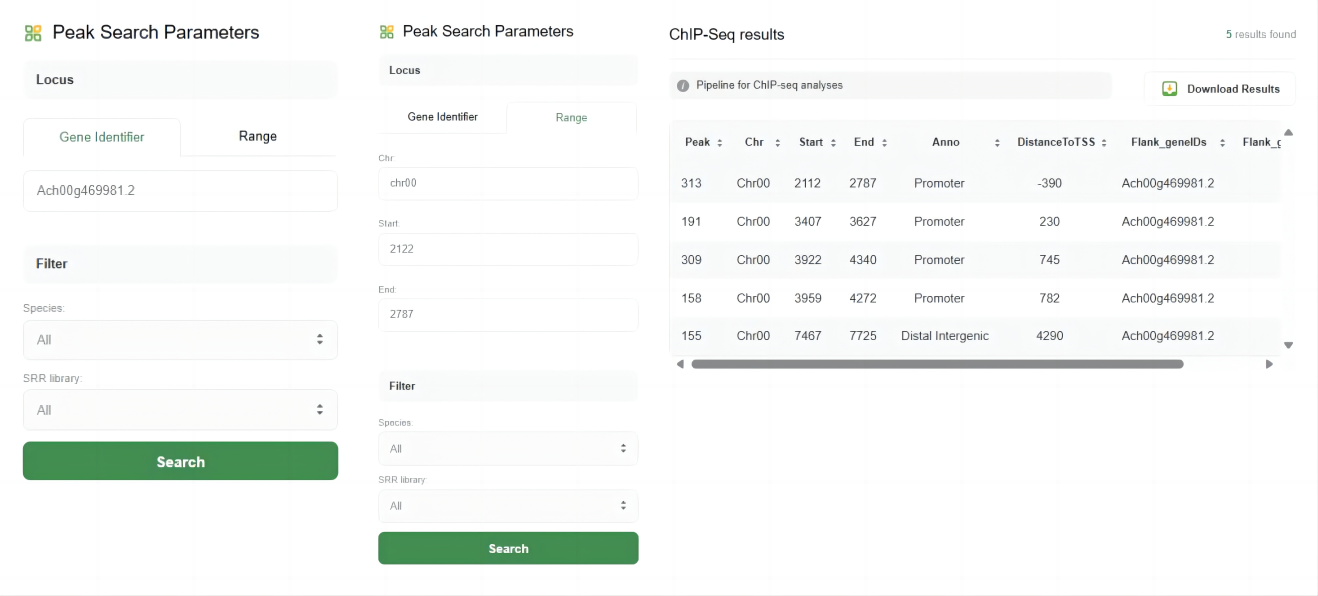
The ChIP-Seq tool in WP-MOD is designed for analyzing chromatin immunoprecipitation sequencing (ChIP-Seq) data, allowing users to identify and study DNA-protein interactions across different species.
The key features of this tool include:
1.Peak Search Parameters
Users can search for ChIP-Seq peaks based on specific loci or genomic ranges. The parameters include:
♦ Gene Identifier:
Enter the gene ID to find peaks associated with a specific gene.
♦ Range:
Define a specific genomic range by providing the chromosome, start, and end positions.
2.Filter Options
Users can filter the search results by species and SRR (Sequence Read Archive) library to refine their search.
3.Search Results
After submitting the search, the results are displayed in a table format with the following columns:
♦ Peak:
The peak identifier.
♦ Chr:
The chromosome on which the peak is located.
♦ Start:
The start position of the peak.
♦ End:
The end position of the peak.
♦ Anno:
The annotation of the peak, such as Promoter, Distal Intergenic, etc.
♦ DistanceToTSS:
The distance of the peak to the transcription start site (TSS).
♦ Flank_geneIDs:
Gene IDs flanking the peak.
♦ Flank_gene_distances:
Distances to the flanking genes.
4.Download Results
Users can download the search results for further analysis by clicking the "Download Results" button.
5. Software and Parameters
♦ Trim Galore (Adapter Trimming):
Software: Trim Galore
Parameters: '-q 20 --stringency 3 --length 20 --gzip'
Purpose: Removes adapters and low-quality bases from ChIP-Seq raw reads, preparing data for downstream alignment.
♦ Bowtie2 (Read Mapping):
Software: Bowtie2
Parameters: '-p 10 -x genome_index -1 Purpose: Maps cleaned ChIP-Seq reads to the reference genome, producing sorted BAM files for peak calling.
♦ MACS2 (Peak Calling):
Software: MACS2
Parameters: '--nomodel -f AUTO --keep-dup 1 -q 0.05 -B -g Purpose: Identifies significant enrichment regions (peaks) in the genome that represent potential DNA-protein interaction sites.
This pipeline ensures high-quality ChIP-Seq analysis by integrating adapter trimming, read alignment, and peak calling to identify DNA-protein interaction sites.
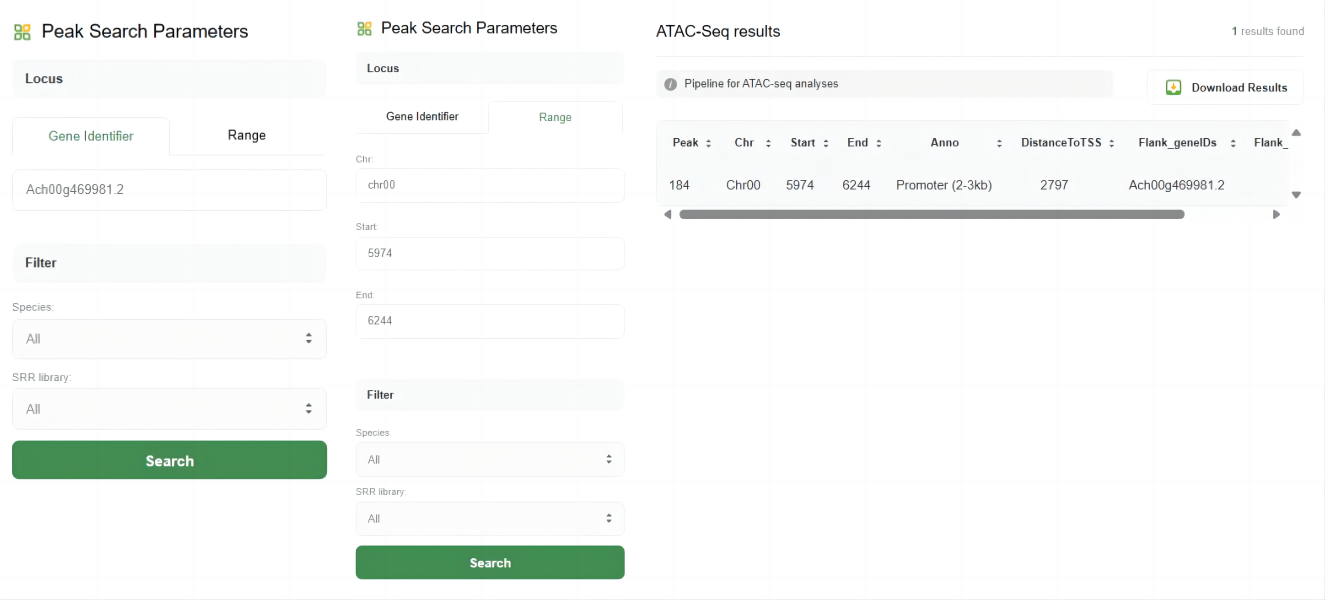
The ATAC-Seq tool in WP-MOD is designed for analyzing Assay for Transposase-Accessible Chromatin using sequencing (ATAC-Seq) data, allowing users to identify and study open chromatin regions across different species.
The key features of this tool include:
1.Peak Search Parameters
Users can search for ATAC-Seq peaks based on specific loci or genomic ranges. The parameters include:
♦ Gene Identifier:
Enter the gene ID to find peaks associated with a specific gene.
♦ Range:
Define a specific genomic range by providing the chromosome, start, and end positions.
2.Filter Options
Users can filter the search results by species and SRR (Sequence Read Archive) library to refine their search.
3.Search Results
After submitting the search, the results are displayed in a table format with the following columns:
♦ Peak:
The peak identifier.
♦ Chr:
The chromosome on which the peak is located.
♦ Start:
The start position of the peak.
♦ End:
The end position of the peak.
♦ Anno:
The annotation of the peak, such as Promoter, Distal Intergenic, etc.
♦ DistanceToTSS:
The distance of the peak to the transcription start site (TSS).
♦ Flank_geneIDs:
Gene IDs flanking the peak.
♦ Flank_gene_distances:
Distances to the flanking genes.
4.Download Results
Users can download the search results for further analysis by clicking the "Download Results" button.
5. Software and Parameters
♦ Trim Galore (Adapter Trimming):
Software: Trim Galore
Parameters: '-q 20 --stringency 3 --length 20 --gzip'
Purpose: Removes adapters and low-quality bases from ATAC-Seq raw reads, ensuring clean data for downstream alignment.
♦ Bowtie2 (Read Mapping):
Software: Bowtie2
Parameters: '-p 10 -x genome_index -1 Purpose: Maps cleaned ATAC-Seq reads to the reference genome, producing sorted BAM files for peak calling.
♦ MACS2 (Peak Calling):
Software: MACS2
Parameters: '--nomodel -f AUTO --keep-dup 1 -q 0.05 -B -g Purpose: Identifies significant enrichment regions (peaks) in the genome, representing open chromatin sites and accessible regulatory elements.
This pipeline ensures reliable ATAC-Seq data analysis by integrating adapter trimming, read alignment, and peak calling to study chromatin accessibility and open chromatin regions.
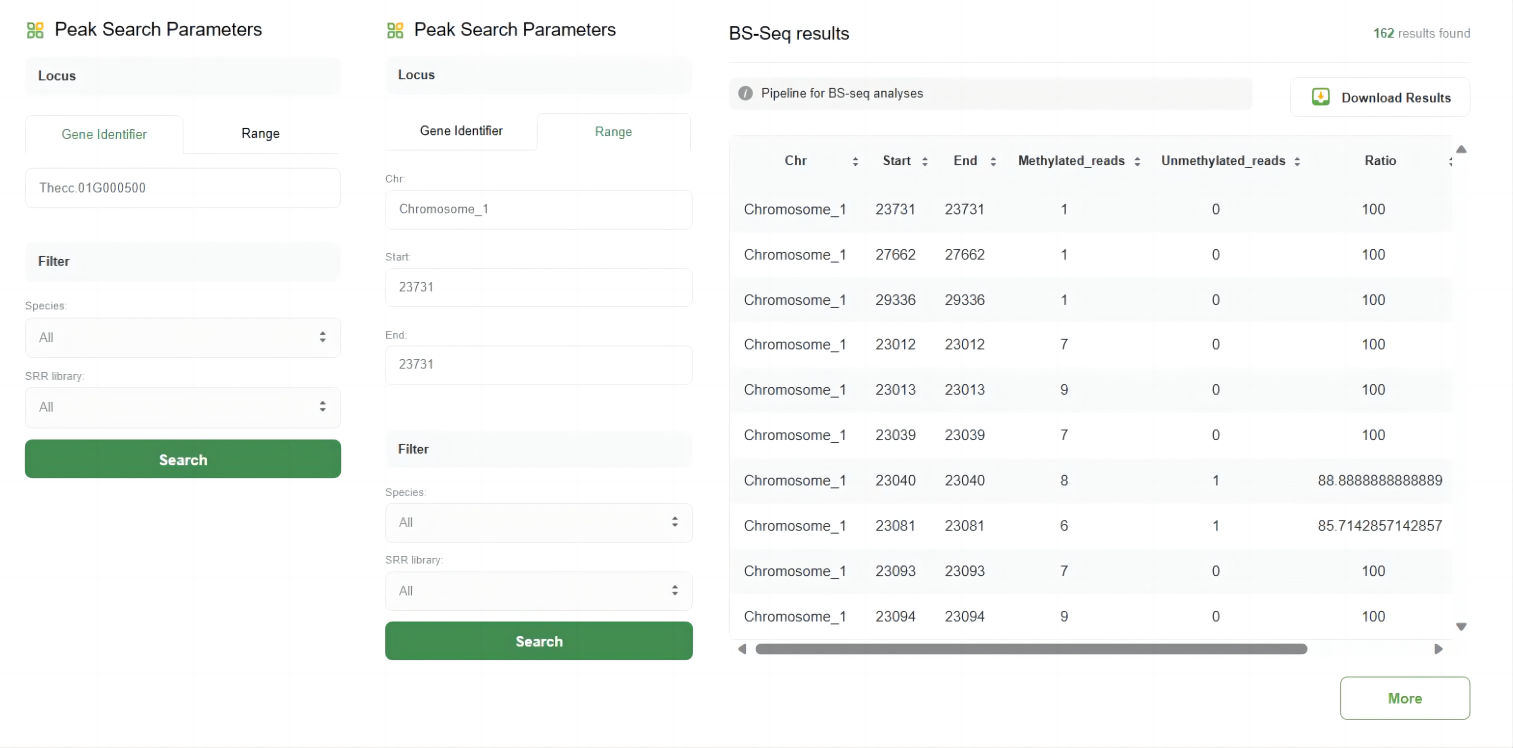
The BS-Seq tool in WP-MOD is designed for analyzing bisulfite sequencing (BS-Seq) data, allowing users to identify and study DNA methylation patterns across different species and genomic regions.
The key features of this tool include:
1.Peak Search Parameters
Users can search for methylation peaks based on specific loci or genomic ranges. The parameters include:
♦ Gene Identifier:
Enter the gene ID to find peaks associated with a specific gene.
♦ Range:
Define a specific genomic range by providing the chromosome, start, and end positions.
2.Filter Options
Users can filter the search results by species and SRR (Sequence Read Archive) library to refine their search.
3.Search Results
After submitting the search, the results are displayed in a table format with the following columns:
♦ Chr:
The chromosome on which the peak is located.
♦ Start:
The start position of the peak.
♦ End:
The end position of the peak.
♦ Methylated_reads:
The number of methylated reads at the position.
♦ Unmethylated_reads:
The number of unmethylated reads at the position.
♦ Ratio:
The ratio of methylated to unmethylated reads.
♦ Flank_geneIDs:
Gene IDs flanking the peak.
4.Download Results
Users can download the search results for further analysis by clicking the "Download Results" button.
5. Software and Parameters
♦ Trim Galore (Adapter Trimming):
Software: Trim Galore
Parameters: `-q 20 --stringency 3 --length 20 --gzip`
Purpose: Removes adapters and filters low-quality bases from BS-Seq raw reads to prepare clean data for downstream analysis.
♦ Bismark (Alignment and Methylation Analysis):
Software: Bismark
Parameters:
Step 1: 'bismark_genome_preparation' to index the reference genome.
Step 2: '--bowtie2 -N 0 -L 20 -p Step 3: 'deduplicate_bismark' to remove PCR duplicates.
Step 4: 'bismark_methylation_extractor --bedGraph --counts --comprehensive' to extract methylation calls.
Purpose: Aligns reads to the bisulfite-converted reference genome, removes duplicates, and extracts comprehensive methylation data for further analysis.
This pipeline ensures accurate DNA methylation analysis, integrating adapter trimming, alignment, deduplication, and methylation call extraction to provide high-quality methylation profiles.
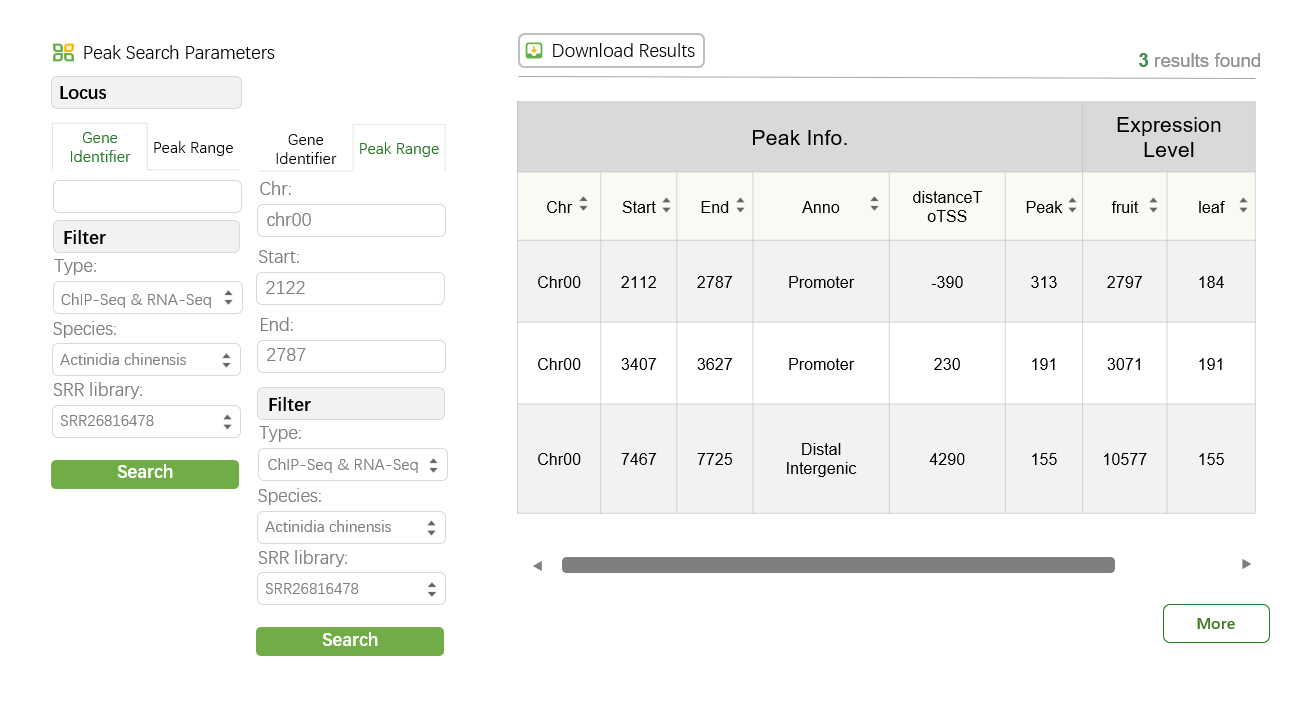
The RNA-Seq & ChIP or ATAC-Seq tool in WP-MOD enables the integrated analysis of RNA sequencing data and ChIP-Seq or ATAC-Seq peaks, allowing users to investigate gene expression levels and DNA-protein or chromatin accessibility interactions across genomic loci.
The key features of this tool include:
1. Peak Search Parameters
Users can search for ChIP-Seq or ATAC-Seq peaks based on specific loci or genomic ranges. The parameters include:
♦ Gene Identifier:
Users can input a specific gene ID to search for associated peaks.
♦ Range:
Define a genomic range by specifying the chromosome, start, and end positions.
2. Type Options
The tool provides two types of integrated analyses to choose from:
♦ ChIP-Seq & RNA-Seq:
Combines chromatin immunoprecipitation sequencing peaks with RNA expression levels.
♦ ATAC-Seq & RNA-Seq:
Integrates chromatin accessibility (via ATAC-Seq) and RNA expression data.
This flexibility allows users to analyze either DNA-protein interactions or chromatin accessibility alongside gene expression data.
3. Filter Options
To refine the search results, users can filter by:
♦ Species:
Choose the species of interest.
♦ SRR Library:
Specify the Sequence Read Archive (SRA) library ID.
4. Search Results
The search results are displayed in a dynamic table format, showing key peak and expression details. The table includes the following columns:
♦ Chr:
The chromosome where the peak is located.
♦ Start:
The start position of the peak.
♦ End:
The end position of the peak.
♦ Anno:
Peak annotation, such as Promoter or Distal Intergenic.
♦ DistanceToTSS:
The distance of the peak to the transcription start site (TSS).
♦ Peak:
The signal intensity of the peak.
♦ Expression Level:
Displays RNA expression values for specific tissues or conditions.
5. Download Results
Users can download the search results in a table format for further analysis by clicking the "Download Results" button.
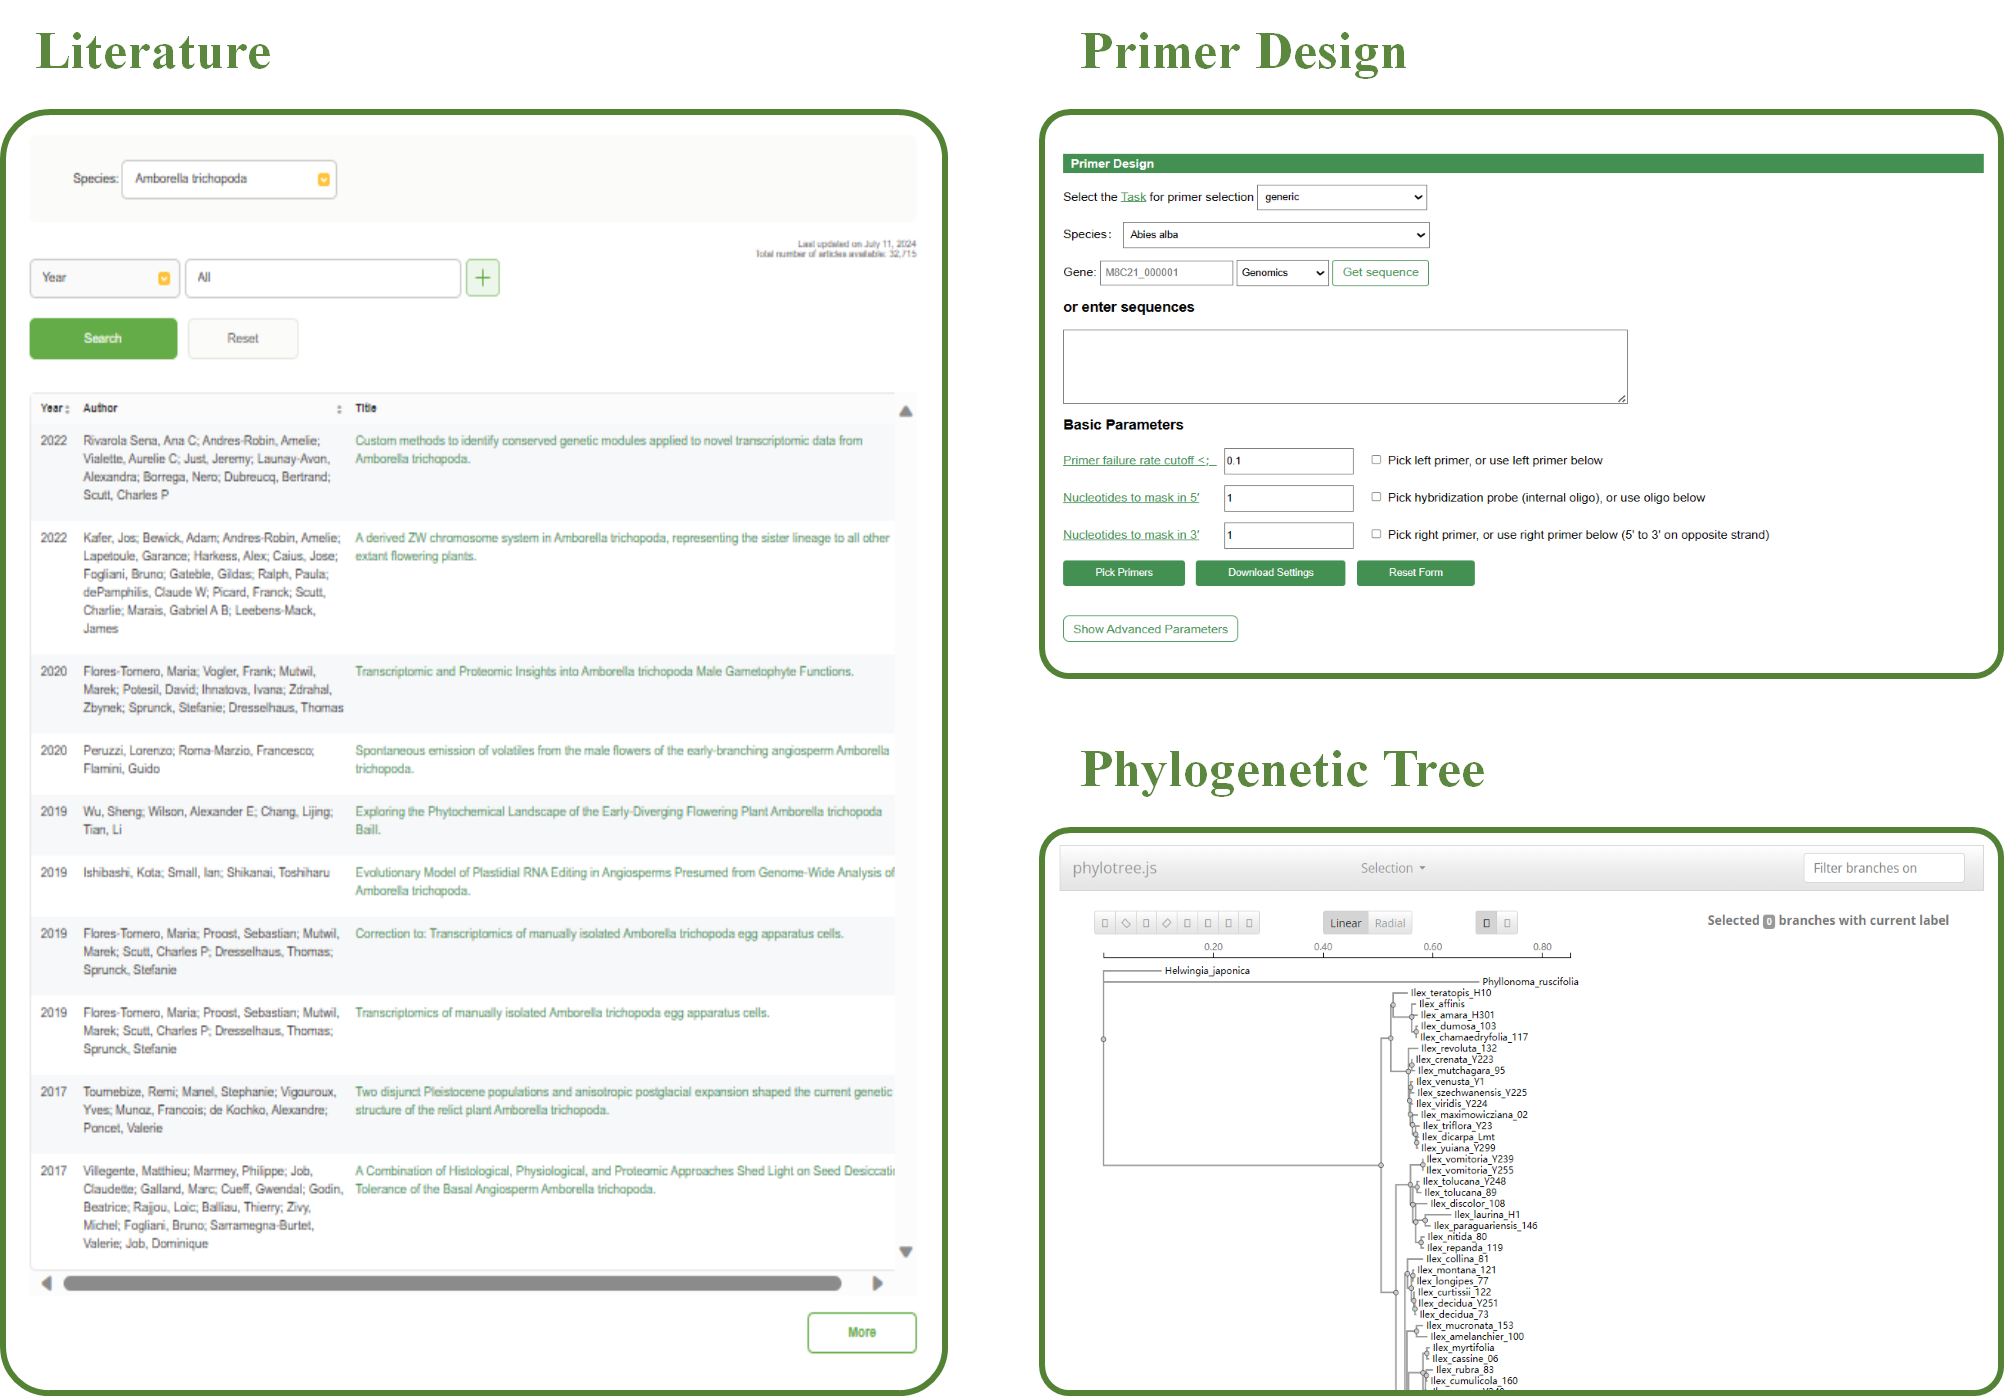
The Literature Search tool in WP-MOD is designed to help users find relevant scientific publications related to specific species and criteria.
The key features of this tool include:
1.Species Selection
Users can select the desired species from a dropdown menu to focus their search on publications related to that species.
2.Search Filters
Users can refine their search using various filters:
♦ Year:
Filter publications by the year of publication.
♦ Author:
Filter by the author's name.
♦ Title:
Filter by the title of the publication.
♦ Journal:
Filter by the journal in which the publication appeared.
♦ Keyword:
Filter by specific keywords associated with the publication.
♦ Abstract:
Filter by keywords in the abstract.
3.Search Functionality
Users can enter specific criteria and use the search functionality to retrieve a list of relevant publications. Multiple criteria can be combined to narrow down the search results.
4.Search Results
The search results are displayed in a table format with the following columns:
♦ Year:
The publication year of the article.
♦ Author:
The authors of the publication.
♦ Title:
The title of the publication. Users can click on the title to be redirected to the full article.
The table is sortable, allowing users to organize the results based on their preference.
5.Reset Option
Users can reset the search parameters to start a new search with different criteria.
WP-MOD offers a primer design tool that allows users to quickly design primers by inputting the desired sequence. This tool facilitates efficient and accurate primer design for various applications. Input one gene id or just nucleotide sequences in textbox, then click on ‘Pick Primers’, results will be returned on web. More parameters can be changed in ‘Advanced Parameters’ module. The source code of Primer Design is modified from Primer3.
The Phylogenetic Tree tool provides a dynamic and interactive platform to visualize evolutionary relationships across different families of species. Users can explore tree structures, analyze hierarchical relationships, and interact with specific nodes or branches for detailed insights.
1. Family Selection
♦ Select Family:
Users can choose different families to generate corresponding phylogenetic trees.
2. Branch Filtering
♦ Filter Branches:
Use the 'Filter branches on' input box to search for and highlight branches based on specific labels or keywords, improving the clarity of large trees.
3. Tree Layout and Visualization
♦ Linear and Radial Views:
Users can switch between 'Linear' and 'Radial' layouts for better visualization of evolutionary relationships.
♦ Zoom and Pan:
Interactive tools enable users to zoom in/out and pan across the tree to focus on specific regions.
♦ Scale Bar:
A scale bar at the top of the tree displays evolutionary distances, helping users interpret branch lengths accurately.
4. Interactive Controls
♦ Incident Branch:
Highlights the branch immediately connected to the selected node.
♦ Path to Root:
Displays the path from the selected node to the tree root.
♦ Reroot on this Node:
Resets the tree root to the chosen node.
♦ Hide this Node:
Temporarily hides the selected node and its descendant branches.
These options allow users to customize and simplify the tree for targeted analysis.
5. Node Interaction
Left-clicking a node opens a context menu with the following options:
♦ Collapse Subtree:
Users can collapse specific subtrees to hide all descendant branches for a cleaner visualization.
♦ Toggle Selection:
Highlight all terminal, internal, or descendant branches for deeper analysis.
This tool integrates interactive visualization and flexible filtering options, enabling researchers to explore and analyze phylogenetic trees for different families efficiently. The combination of family selection, dynamic node interactions, and customizable views makes this tool highly versatile for evolutionary studies.
All data in WP-MOD can be downloaded in Data page.
The plant images in WP-MOD were sourced from
Plants of the World Online,
Chinese Virtual Herbarium,
and Plant Illustrations.
If you meet any troubles or find any bugs when you visit WP-MOD, please email to Contact@woodyplant.com.
▶Data